 When you decide to implement a new software solution, one of the choices you’ll certainly face is: “Commercial vs. free software”. No debate here: you’ve to make the best choice depending on the requirements. They can be technical constraints, budget, support, etc. I’m working with commercial solutions which perform (generally) good job but I also like to build my own solutions which do exactly what I need, no more no less. By selecting piece of software on the “free” market, you can build very nice solutions.
One disadvantage: you’ve to fine-tune or adapt the product to really make it work as YOU want. Some people will say that the gains made by choosing free solutions are often lost in configuration and debugging time. Indeed but, for personal development, I found this even more interesting and priceless. Here is an example: the integration of OSSEC with Splunk. Both are excellent free products (The free license of Splunk has limitations but is enough for personal usage). OSSEC has its own web user interface. Perfect to manage your OSSEC server and agents but I don’t like the way events are presented and managed. From my point of view, Splunk is the best tool to manage your flow of events (on the “free” market)!
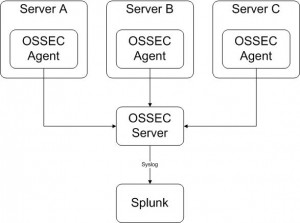
Practically, I’m managing my event flows in an infrastructure like this:

The OSSEC agents are centrally managed from the OSSEC server and send events to the same box (a classic architecture). The OSSEC server is configured to send a copy of the collected events to a Splunk server. In your ossec.conf file, add the following configuration block:
<syslog_output>
    <server>6.7.8.9</server>
     <port>10002</port>
</syslog_output>
On Splunk side, just install the application called Splunk for OSSEC. Restart both servers and your events will be received by Splunk and indexed. Simple! But… Due to the format of the Syslog message sent by the OSSEC server, all messages are seen by Splunk as coming from the same host: the OSSEC server itself. This is clearly not very convenient. If you check a standard OSSEC event, the origin (the OSSEC agent) can be easily extracted:
** Alert 1272239502.74396: - syslog,sshd,
2010 Apr 26 01:51:42 (foobar) 10.255.0.1->/var/log/authlog
Rule: 5704 (level 4) -> 'Timeout while logging in (sshd).'
Src IP: (none)
User: (none)
Apr 26 01:51:41 foobar sshd[15318]: fatal: Timeout before authentication for 1.2.3.4
In this example, the source of the event is the computer called “foobar”. The problem was to extract this information and let Splunk use it as the real source of the event. Paul Southerington, who wrote the “Splunk for OSSEC” application, helped me to fix this issue via the OSSEC Google group. As this can be valuable to other OSSEC/Splunk users, here are Paul’s change in the Splunk configuration files:
1. If the directory isn’t already there, mkdir $SPLUNK_HOME/etc/apps/splunk-for-ossec/local
2. Paste the following into $SPLUNK_HOME/etc/apps/splunk-for-ossec/local/transforms.conf
[ossec-syslog-hostoverride1]
# Location: (winsrvr) 10.20.30.40->WinEvtLog;
DEST_KEY = MetaData:Host
REGEX = ossec: Alert.*?Location: \((.*?)\) ([\d\.]+)->
FORMAT = host::$1

[ossec-syslog-hostoverride2]
DEST_KEY = MetaData:Host
REGEX = ossec: Alert.*?Location: ([^\(\)]+)->
FORMAT = host::$1

[ossec-syslog-ossecserver]
REGEX = \s(\S+) ossec:\s
FORMAT = ossec_server::$1
3. Paste the following into /opt/splunk/etc/apps/splunk-for-ossec/local/props.conf
[ossec]
FIELDALIAS-ossec-server=
REPORT-ossecserver = ossec-syslog-ossecserver
TRANSFORMS-host = ossec-syslog-hostoverride1,ossec-syslog-hostoverride2
Restart your Splunk server again and now your events will be correctly split into multiple sources according to the OSSEC agent! Thanks a lot to Paul for his help!
Hello Tony,
You can forward all events via syslog_output or only alerts above a specific level if specified:
<syslog_output>
<level>5</level>
<server>10.0.0.1</server>
</syslog_output>
Regards,
Xavier
This article speaks of events being sent to Splunk but doesn’t the above config only send alerts?
-Tony
Hi,
You can find an updated version of OSSEC for splunk here:
http://splunkbase.splunk.com/apps/All/4.x/app:Splunk+for+OSSEC+-+Splunk+v4+version
Hey Andre,
I’m using Splunk 4.1.5 at the moment! No big issue!
Does it work with a fairly recent version of splunk? I never tried it out, because the app page says it’s for splunk 3.x only.