 This topic is not brand new, there exists plenty of solutions to forward Windows event logs to Logstash (OSSEC, Snare or NXlog amongst many others). They perform a decent job to collect events on running systems but they need to deploy extra piece of software on the target operating systems. For a specific case, I was looking for a solution to quickly transfer event logs from a live system without having to install extra software.
The latest versions of the Microsoft Windows come with Powershell installed by default. Powershell is, as defined by Wikipedia, a task automation and configuration management framework. PowerShell 3 introduced nice cmdlets to convert data from/to JSON which is a format natively supported by Logstash. The goal is to have a standalone Powershell script executed from a share or a read-only USB-stick that will process Windows event logs and send them to a remote preconfigured Logstash server on a specific TCP port.
The first step is to prepare our Logstash environment to receive new events. Let’s create a new input and store received events to a dedicated index (it will be easier to investigate the collected data):
input {
    tcp {
        port => 5001
        type => 'eventlog'
        codec => json {
            charset => 'UTF-8'
        }
    }
}

filter {
    if [type == 'eventlog' {
        grok {
            match => [ 'TimeCreated', "Date\(%{NUMBER:timestamp}\)" ]
        }
        date {
            match => [ 'timestamp', 'UNIX_MS' ]
        }
    }
output {
    if [type == 'eventlog' {
        elasticsearch {
            host => 'localhost'
            port => 9300
            node_name => 'forensics'
            cluster => 'forensics-cluster'
            index => 'logstash-evenlog-%{+YYYY.MM.dd}'
       }
    }
}
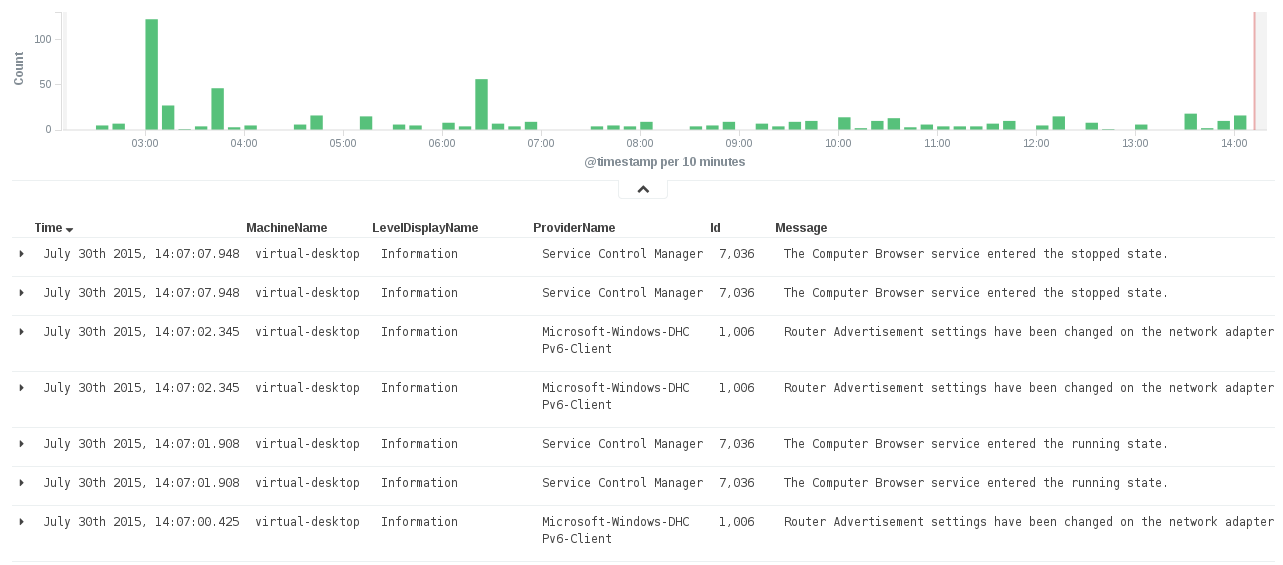
The Powershell script collects event logs via the cmdled Get-WinEvent and convert them in JSON format with ConvertTo-Json. The fact that Logstash expects one event per line, data received by Get-WinEvent are converted to an array and processed in a loop. Before sending the event via a TCP session, ‘\r’ and ‘\n’ are removed. Edit the script, change the destination IP/port and just execute the script to send a copy of all the event logs to your Logstash (take care, it could overload your server). A few minutes later (depending on the amount of data to index), you’ll be able to investigate the events from your favourite Kibana session:
Some remarks:
- The script must be run by an administrator to access all eventlogs (especially “security”).
- It is possible to automate the export of event logs via an automated task and by applying a filter to get-WinEvent. In the following example, events for the last hour are processed:
$start = (get-date).addhours(-1)
$data = get-winevent -FilterHashtable @{logname=”*”;starttime=$start}
The script is available in my github.com repository.
Hello,
i tried the script on a Windows 2008 Server, with admin rights, powershell 3.0, but the script doesn’t work, i have the following error on each eventlog entry:
You cannot call a method on a null-valued expression.
At C:\Users\a-winter\send-events.ps1:38 char:3
+ $writer.WriteLine($x)
+ ~~~~~~~~~~~~~~~~~~~~~
+ CategoryInfo : InvalidOperation: (:) [], RuntimeException
+ FullyQualifiedErrorId : InvokeMethodOnNull
You cannot call a method on a null-valued expression.
At C:\Users\a-winter\send-events.ps1:39 char:3
+ $writer.Flush()
+ ~~~~~~~~~~~~~~~
+ CategoryInfo : InvalidOperation: (:) [], RuntimeException
+ FullyQualifiedErrorId : InvokeMethodOnNull
I don’t know, what fails
Thanks for sharing a lot of useful info and I am excited about setting it up in my environment but need small help with syntax of logstash.conf
PS C:\Monitoring\Logstash\bin> .\logstash.bat -f logstash.conf ‘–configtest’
io/console not supported; tty will not be manipulated
!!! Please upgrade your java version, the current version ‘1.7.0_25-b17’ may cause problems. We recommend a minimum vers
ion of 1.7.0_51
Error: Expected ] at line 14, column 37 (byte 230) after filter {
if [type == ‘eventlog’ {
grok {
match => [ ‘TimeCreated’
PS C:\Monitoring\Logstash\bin>
I am having my logstash in same machine where i capture the eventlog. I could get the event log but not received by logstash. Please suggest
Hi,
I have deployed ELk stack to collect Windows Event log in the following manner:
Two servers, i.e. Server X = for Logstash and Server Y = running Elasticsearch, Kibana, and NxLog.
I am pushing Windows event logs from our Domain Controllers to Server Y using Windows native log subscription model. NxLog is shipping logs from Server Y to Server X for logstash processing. Server X then push back those logs to Server y for ElasticSearch.
Now, where should I run PowerShell script and which one?
It’s me again :-p
when I execute the Powershell script I’ve this error:
ConvertFrom-Json : Error during serialization or deserialization using the JSON JavaScriptSerializer. The length of the string exceeds the value set on the maxJsonLength property.
However everything is ok with the script but the message appears :-/
Fixed again, shame on me!
I found the last error 🙂
You should replace UNIX_MX by UNIX_MS 🙂
Without the filter it works like a charm.
But in Kibane Created date is on epoch time format.
I think this is why you try to make a match with grok.
I don’t know grok syntax so I’ll try to help you to debug in my side.
Thanks,
I’ve tried it myself to, but now with your example I’ve this error in
logstash.log
——————
{:timestamp=>”2015-08-25T20:45:11.089000+0200″, :message=>”SIGTERM received. Shutting down the pipeline.”, :level=>:warn}
{:timestamp=>”2015-08-25T20:45:36.240000+0200″, :message=>”Error: Cannot register filter date plugin. The error reported is: \n Illegal pattern component: U for pattern ‘UNIX_MX'”}
{:timestamp=>”2015-08-25T20:45:36.242000+0200″, :message=>”You may be interested in the ‘–configtest’ flag which you can\nuse to validate logstash’s configuration before you choose\nto restart a running system.”}
—————–
And on
logstash.stdout
——————-
Error: Cannot register filter date plugin. The error reported is:
Illegal pattern component: U for pattern ‘UNIX_MX’
You may be interested in the ‘–configtest’ flag which you can
use to validate logstash’s configuration before you choose
to restart a running system.
—————————————
Strange because it should works.
If your have the config file could you please upload it in you github space?
Regards
Fixed! Tx! I had issues to copy/paste the code and typed it manually…
Another typo
filer instead of filter…
is it possible to paste the correct config file?
I’ve some problem to reproduce it
thx in advance
Seems that the logstash config file contains typos :/
codec => json
Missing ]
…
RT @xme: [/dev/random] Sending Windows Event Logs to Logstash https://t.co/AIswlx2iZW
RT @xme: [/dev/random] Sending Windows Event Logs to Logstash https://t.co/AIswlx2iZW
RT @xme: [/dev/random] Sending Windows Event Logs to Logstash https://t.co/AIswlx2iZW
RT @xme: [/dev/random] Sending Windows Event Logs to Logstash https://t.co/AIswlx2iZW
RT @xme: [/dev/random] Sending Windows Event Logs to Logstash https://t.co/AIswlx2iZW
RT @xme: [/dev/random] Sending Windows Event Logs to Logstash https://t.co/AIswlx2iZW
RT @xme: [/dev/random] Sending Windows Event Logs to Logstash https://t.co/AIswlx2iZW
RT @xme: [/dev/random] Sending Windows Event Logs to Logstash https://t.co/AIswlx2iZW
RT @xme: [/dev/random] Sending Windows Event Logs to Logstash https://t.co/AIswlx2iZW
RT @xme: [/dev/random] Sending Windows Event Logs to Logstash https://t.co/AIswlx2iZW