When I talk to customers about monitoring, they often have a vague idea about the way to implement a solution. Monitoring must be part of your security policy. Your tools (whatever the product you choose – no name here) must help you to stick to the CIA principle: Confidentiality (to monitor the alerts sent by your DLP sensors), Integrity (to monitor any suspicious change to your websites or databases) and availability (to monitor your servers and networks health). But a monitoring solution will also help you to achieve your business.
The monitoring of your IT infrastructure is a complex project with constraints in terms of time, costs (hardware, software and human resources) and integration. A few words about the last constraint: The integration of monitoring components in an existing infrastructure may often come to issues at multiple levels: security, performances or simply incompatibility with some existing components.
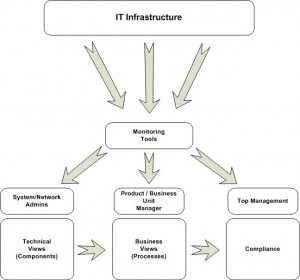
The critical step is to clearly define the key indicators which reflect the health of your infrastructure. Don’t try to monitor too much, stick to the KPI’s. Let’s have a look at the following schema:
 |
In this (light) organization, the IT infrastructure is unique but the different teams require different “views” to accomplish their job in the best conditions:
- System and network administrators:
They have the highest technical profiles and need a complete overview of all the components. They must react in no time when an incident occurs.
Example: a disk full, a router down, an overloaded mail server (Note that the final goal of the monitoring is to prevent such incidents). - Product managers or business unit managers:
They are responsible of one or more flows which take input data, process them to produce valuable information for the company. For those guys, it’s critical to know if the process runs correctly. They require business views: A real-time graphical representation of the data flows - Top management:
The managers are only interested in a global overview of the company health and must take care of the business continuity (due diligence). They require dashboards: Representation of the company KPI’s compared with the past and estimation of the future (trending). If the business is linked to a regulatory compliance, the management will need the monitoring data to build compliance reports.
The flow of information can follow several paths. The monitoring tools must collect all technical information from the IT components (routers, switches, appliances, servers, application, …). Don’t forget to collect logs!
In real time, we have a top-down approach: the monitoring tools will re-format the collected information in a “readable” output for the different teams with different security levels. Here is an example with a firewall in trouble:
- At technical level, the administrators receive an alert about a firewall down. For them, this is a critical problem to be investigated immediately.
State: RED. - At business level, the product manager see his application running in degraded mode (the firewall is part of a cluster, the backup node took the relay). No action is required but he must be aware of the problem.
State: ORANGE. - At management level, there is no impact, security level is ok, company assets are still protected.
State: GREEN
But problems can grow with an escalation of the notification levels. Now, let’s imagine that the second firewall in the cluster does not take the relay? In this case, we have maybe an upcoming crisis: if the status at technical level remains the same, the status is raised to RED at business level (the process is interrupted) and, at management level, the status is raised to ORANGE: Managers must be ready to face a crisis and take urgent decisions (and maybe to trigger a DRP plan).
However, we have a left-to-right approach for the recurrent reporting (weekly, monthly, …). From technical information gathered during a defined period, statistics are generated and forwarded to the business units. The business analyze the statistics and compare them with the defined SLA. Finally, a condensed review (dashboards) is given to the top management (KPI, sales revenues, trending, …)
As you can see here, your monitoring solution will be used at several layers inside your organization. For each of them, the presentation of the information as well as the notification delays will be different. Think about it!