 Implementing a good log management solution is not an easy task! If your organisation decides (should I add “finally“?) to deploy “tools” to manage your huge amount of logs, it’s a very good step forward but it must be properly addressed. Devices and applications have plenty of ways to generate logs. They could send SNMP traps, Syslog messages, write in a flat file, write in a SQL database or even send smoke signals (thanks to our best friends the developers). It’s definitively not an out-of-the-box solution that must be deployed. Please, do NOT trust $VENDORS who argue that their killing-top-notch-solution will be installed in a few days and collect everything for you! Before trying to extract the gold of your logs, you must correctly collect events. This mean first of all: do not loose some of them. It’s a good opportunity to remind the Murphy’s laws here: The lost event will always be the one which contained the most critical piece of information! In most cases, a log management solution will be installed on top of an existing architecture. This involves several constraints:
- From a security point of view, firewalls will for sure block flows used by the tools. Their policy must be adapted. The same applies to the applications or devices.
- From a performance point of view, the tools can’t have a negative impact on the “business” traffic.
- From a compliance point of view, the events must be properly handled in respect of the confidentiality, integrity and availability (you know the well-know CIA principle).
- From a human point of view (maybe the most important), you will have to fight with other teams and ask them to change the way they work. Be social! 😉
To achieve those requirements, or at least trying to reach them, your tools must be deployed in a distributed architecture. By “distributed“, I mean using multiple software componants desployed in multiple places in your infrastructure. The primary reason for this is to collect the events as close as possible to their original source. If you do this, you will be able to respect the CIA principle and:
- To control the resources usage to process them and centralise them
- To get rid of proprietary or open multiple protocols
- To control the good processing of them from A to Z.
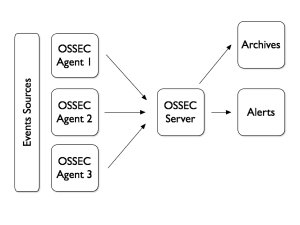
For those who are regular readers of my blog, you know that I’m a big fan of OSSEC. This solution implements a distributed architecture with agents installed on multiple collection points to grab and centralise the logs:
 OSSEC is great but lack of a good web interface to search for events and generate reports. Lot of people interconnect their OSSEC server with a Splunk instance. There is a very good integration of both products using a dedicated Splunk app. Usually, Splunk is deployed on the OSSEC server itself. The classic way to let Splunk collect OSSEC events is to configure a new Syslog destination for alerts like this (in your ossec.conf file):
<syslog_output>
<server>10.10.10.10</server>
<port>10001</port>
</syslog_output>
This configuration blog will send alerts (only!) to Splunk via Syslog messages sent to 10.10.10.10:10001 (where Splunk will listen for them). Note that the latest OSSEC version (2.7) can write native Splunk events over UDP. Personally, I don’t like this way of forwarding events because UDP remains unreliable and only OSSEC alerts are forwarded. I prefer to process the OSSEC files using the file monitor feature of Splunk:
[monitor:///data/ossec/logs]
whitelist=\.log$
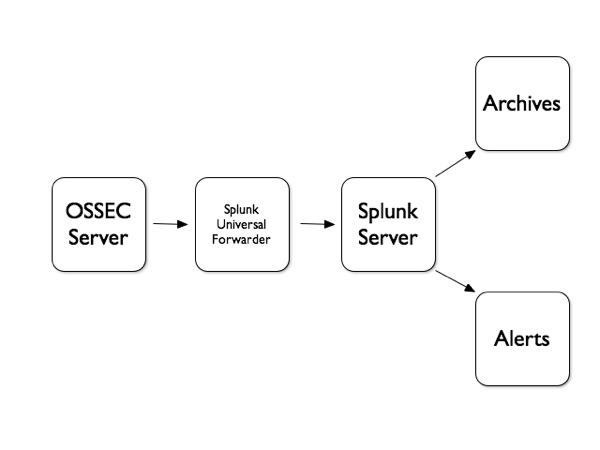
But what if you have multiple OSSEC server across multiple locations? Splunk has also a solution for this called the “Universal Forwarder“. Basically, this is a light Splunk instance which is installed without any console. This goal is just to collect events in the native format and forward them to a central Splunk instance (the “Indexer“):

If you have experience with ArcSight products, you can compare the Splunk Indexer with the ArcSight Logger and the Universal Forwarder with the SmartConnector. The configuration is pretty straight forward. Let’s assume that you already have a Splunk server running. In your $SPLUNK_HOME/etc/system/local/inputs.conf, create a new input:
[splunktcp-ssl:10002]
 disabled = false
 sourcetype = tcp-10002
 queue = indexQueue

[SSL]
 password = xxxxxxxx
 rootCA = $SPLUNK_HOME/etc/auth/cacert.pem
 serverCert = $SPLUNK_HOME/etc/auth/server.pem
Restart Splunk and it will now bind to port 10002 and wait for incoming traffic. Note that you can use the provided certificate or use your own. It’s of course recommended to encrypt the traffic over SSL! Now install an Universal Forwarder. Like the regular Splunk, packages are available for most modern OS. Let’s play with Ubuntu:
# dpkg -i splunkforwarder-5.0.1-143156-linux-2.6-intel.deb
Configuration can be achieved via the command line but it’s very easy to do it directly by editing the *.conf files. Configure your Indexer in the $SPLUNK_HOME/etc/system/local/outputs.conf:
[tcpout]
 defaultGroup = splunkssl

[tcpout:splunkssl]
 server = splunk.index.tld:10003
 sslVerifyServerCert = false
 sslCertPath = $SPLUNK_HOME/etc/auth/server.pem
 sslPassword = xxxxxxxx
 sslRootCAPath = $SPLUNK_HOME/etc/auth/cacert.pem
The Universal Forwarder inputs.conf file is a normal one. Just define all your sources there and start the process. It will start forwarding all the collected events to the forwarder. This is a quick example which demonstrate how to improve your log collection process. The Universal Forwarder will take care of the collected events and send them safely to your central Splunk instance (compressed, encrypted) and will queue them in case of outage.
A final note, don’t ask me to compare Splunk, OSSEC or ArcSight. I’m not promoting a tool. I just gave you an example of how to deploy a tool, whatever your choice is 😉
Hello Matthew,
I’m also using analogi on my OSSEC server (for testing purpose only)…
It looks ok but the problem is always the same: having multiple (web|console) interface to investigate incidents is a pain…
Having everything under one screen is so easy (no marketing for Splunk – any log management solution will to the job)
/x
Hi xavier, have you tried the analogi web ui for ossec?
See https://github.com/ECSC/analogi
Ossec can output to MySQL directly (so no need to push data through splunk) – this handy little app is new, but developing quite well.
RT @xme: [/dev/random] Howto: Distributed Splunk Architecture http://t.co/rLiTLpze
RT @xme: [/dev/random] Howto: Distributed Splunk Architecture http://t.co/rLiTLpze
RT @xme: [/dev/random] Howto: Distributed Splunk Architecture http://t.co/rLiTLpze
RT @xme: [/dev/random] Howto: Distributed Splunk Architecture http://t.co/rLiTLpze
RT @xme: [/dev/random] Howto: Distributed Splunk Architecture http://t.co/rLiTLpze
RT @xme: [/dev/random] Howto: Distributed Splunk Architecture http://t.co/rLiTLpze