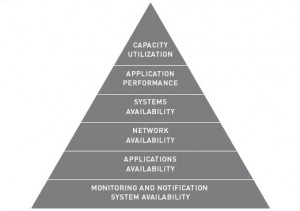
I found this pyramid in a document written by Groundwork. It resumes perfectly how to deploy a monitoring solution in the best way. This post is completely independent of the monitoring tool, choose the best one to meet your expectations.
Often, when a company decides to implement a monitoring/reporting tool, they would like to have nice multi-colored live dashboards, one-click-reports and state-of-the-art notifications integrated into their existing ticketing system. Stop! It’s a complex process.
First, an inventory of the company assets must be performed if not already available. For each device (router, servers, appliances, …) and applications, a criticity level[1] and an owner must be defined, exactly like in risks management. Once done, the pyramid can be analyzed:
[1] The criticity of a system is mandatory and can be converted to a “value” (in terms of money – how much money will be lost if the web server is down two hours – or in terms of quality of services – negative impact against media or concurrents).
 |
It’s a bottom-up approach: the goal is to reach the top of the pyramid. A good starting point is to apply the KISS principle (“Keep It Simple and Stupid“). The monitoring solution must be fully integrated into your existing procedures (example: deployment of a new server, decommissioning of an old server) or new procedures must be written (example: how to properly handle alerts, escalations). Finally, don’t’ forget the training! Your teams must be aware of the new monitoring tool and understand the added plus-value.
Note: per experience, all investments (time, money) will be lost if no proper training is done! The classic error is a flood of alarms sent to support engineers who don’t know the source of the problem and how to solve it!
Now, let’s review all the pyramid levels:
Monitoring and Notification System Availability : Also know as the simple “ping” monitoring. Is my device up or down? It may sound a dummy check to some of you but a lot of companies does not know the status of all their devices. It’s a critical step: the results of this monitoring will be re-used later to perform extra checks like dependencies or parent-child relationships. It’s also the basic check: we do not need to check if the mail server answers to SMTP request if it does not send ICMP echo replies!
Applications Availability : Now that we have a good view of our systems availability, let’s monitor the applications: an Apache server (HTTP), a database server (Oracle, MySQL) or any applications in a client-server model. At this layer, I would like to split the checks in two categories:
- Basic checks: does the application answers to clients requests? Example: does a web server accepts connections on port TCP/80. (We work here at layer 4 of the OSI model)
- Extended checks: Applications give answers but are they correct and valuable? Example: a web server sending a HTTP code 404 (page not found). This has to be notified! (Here we are at layers 5, 6 or 7)
Network Availability : At this level, we can re-use the status of our systems (discovered in the pyramid level 1) and add extra-value: add dependencies between systems (example: do not perform checks on systems behind a router marked as down). Parent-child relationship help to build the network topology.
Systems Availability : Like for the network, dependencies or parent-child relations can be defined between different systems. A web server with dynamic pages generated from a MySQL database is a nice example. If the MySQL server is in trouble, for sure, the web server will also be in trouble and report unexpected information to the clients. Another aspect is the “business view”. It’s important to monitor the status of complex systems (billing systems, web portals, …) based on multiple components (networks and systems).
The goal here is to give a real-time status to customers or product managers. They must be informed of potential troubles in the company business views but don’t care about the technical point of view. We use here “super checks” which check the status of lower level tests. If one or more failed, we can assume that the applications is in trouble.
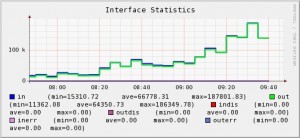
Applications Performance : Good, the status of all the components is now under control but do they interact in a smooth way? Does a switch port reports too much collisions? Is this database server overloaded or the Internet connectivity is 90% full all the time? The goal is this layer is to write down all checks results in databases and to produce nice graphs about systems and network performance:
 |
With performance graphs, administrators have an instant view of the components behavior but can also go back in the past and check performances for a specified period of time (the last week or last Sunday between 02:00am and 03:00am).
Capacity Utilization : Finally, the state of the art in monitoring: capacity utilization or “trending”. We know that the components are up’n’running, we know they process data with good performance but… what about the future? When do we expect a file system to be full? When do we need to upgrade the Internet connectivity? Based on captured data and systems behavior, mathematical models can be used to estimate a specific event such as a disk or CPU usage:
 |
Based on the Holt-Winters Time Series Forecasting Algorithm, it’s possible to predict the system behavior and only generate notifications when needed!
This top layer detaches from the technical basic aspects of monitoring and slides smoothly to management tasks: it can be used as a good tool to make forecasts, budgets or to help managers in decisions. If properly deployed and used, your monitoring solution will have an excellent ROI!
Finally, I would like to add an extra 7th layer to this pyramid (like the well-known layer 8 of the OSI model – the political layer):
Integration with Third Party Software : The monitoring tool is always installed in a production environment where other components are already massively used for years. The best example is a ticketing tool. You cannot replace the existing solution by the monitoring tool or, simply, it does not provide the same level of services! Another example is a reporting platform used by managers. When you choose a monitoring tool, pay attention to the export and integration features. Unused in the first deployment phase, they can become business critical later!