 It has been a while that I did not write an article on log management. Here is a quick how-to about the integration of Check Point firewall logs into ELK. For a while, this log management framework is gaining more and more popularity. ELK is based on three core components: ElasticSearch, Logstash and Kibana. Google is your best friend to find information about ELK. But why Check Point? Usually, I don’t blog about commercial products but I investigated a request from a customer who was looking for a clean solution to integrate this product logs into ELK and I didn’t find my heart’s desire on the Internet
Check Point firewalls are good products amongst others but what I really like is the way they handle logs. By default, logs generated by the firewall modules are sent to the management system (the “SmartCenter“) where they can be reviewed using a powerful fat client but… running only on top of Microsoft Windows systems. To export the logs to an external log management solution, Check Point has developed the OPSEC framework which allows third party applications to interact with firewalls. One of the feature is to get a copy of logs using the LEA protocol. LEA means “Log Export API” and provides the ability to pull logs from a Check Point device via the port TCP/18184. What about Syslog could you ask? It is simply not possible in an out-of-the-box way! To forward logs to a remote Syslog server, you can use the “fwm” command:
# fw log -f -t -n -l 2>/dev/null | awk 'NF' | sed '/^$/d' | logger -p local4.info -t cpwd &
An alternative way is to create a “User Defined Alert” which will call a script for every(!) line of log. In such situations, how to be sure that our firewall will be able to handle a big amount of logs?
Honestly, I don’t like this way of working, it creates new processes on the firewall that can’t be properly controlled and Syslog, even if still mainly used, remains a poor protocol in terms of reliability and security (Note: the Check Point OS – SecurePlatform or Gaia – can be configured to forward Syslog to a remote server). Â The benefits of using OPSEC/LEA are multiple:
- Fully integrated and supported by all Check Point models
- Data are sent over TCP/SSL
- Data are collected using a “pull” mechanism (if the log management solution is offline, logs are not lost and dequeued later)
- Parsing at the destination is easy.
OPSEC is a proprietary framework developed by Check Point but SDK’s are available and developers can write tools which talk to Check Point devices. Commercial log management/SIEM solutions support OPSEC and they MUST do (Check Point is one of the market leaders) but Logstash does not support OPSEC to pull logs natively. That’s why we will use a AitM (“Agent in the Middle” ;-)) to achieve this. Here are the details of the lab and the components I used to integrate a firewall with ELK:
- A standalone Check Point (Gaia R77.20)
- fw1-loggrabber - An opensource tool which uses the OPSEC SDK to collect logs
- opsec_pull_cert – A tool provided by Check Point to extract .p12 certificates from a SmartCenter
- ELK
- Ubuntu 12.04-LTS
The first challenge is to compile fw1-loggrabber on your system. This tool is quite old (2005!) but a fork is available on github.com. You’ll also need the OPSEC SDK 6.0 linux30. The compilation is quite straight forward if you properly adapt the original Makefile (to specify the right location of the SDK). fw1-loggrabber requires two configuration files to work: “fw1-loggrabber.conf” is the primary configuration file and “lea.conf” contains the details about the firewall you’d like to connect to. Here are mine:
# cd /usr/local/fw1-loggrabber
# cat ../etc/fw1-loggrabber.conf
FW1_LOGFILE="fw.log"
FW1_OUTPUT="logs"
FW1_TYPE="ng"
FW1_MODE="normal"
ONLINE_MODE="yes"
RESOLVE_MODE="no"
RECORD_SEPARATOR="|"
LOGGING_CONFIGURATION=file
OUTPUT_FILE_PREFIX="/var/log/checkpoint/fw1"
OUTPUT_FILE_ROTATESIZE=1048576

# cat ../etc/lea.conf
lea_server auth_type sslca
lea_server ip 192.168.254.144
lea_server auth_port 18184
opsec_sic_name "CN=loggrabber-opsec,O=........."
opsec_sslca_file /usr/local/fw1-loggrabber/etc/opsec.p12
lea_server opsec_entity_sic_name "cn=cp_mgmt,o=........."
Before pulling logs out of the firewall, a secure link must be established between the firewall and the OPSEC client based. This one is based on SIC (“Secure Internal Communications“). The Check Point documentation describes step by step how to establish a SIC communication channel. The most critical part will be to export the certificate (the .p12 file referenced in the lea.conf file). Hopefully, to do this, Check Point provides a specific tool delivered with the OPSEC SDK: pull_opsec_cert. Once the firewall is properly configured (and the right communications allowed in the security policy!), the certificate can be extracted via the following command line:
# opsec_pull_cert -h firewall -n opsec-object-name -p passwd -o p12_cert_file
Copy the created .p12 file into the right directory. Now, start the tool and if it works, your log file will start to be populated with interesting lines:
# cd /usr/local/fw1-loggrabber/bin
#./fw1-loggrabber -c ../etc/fw1-loggrabber.conf -l ../etc/lea.conf &
# tail -f /var/log/checkpoint/fw1.log
time=28Aug2014 0:19:08|action=accept|orig=192.168.254.144|i/f_dir=inbound|\
i/f_name=eth1|has_accounting=0|uuid=<53fe595c,00000000,90fea8c0,c0000000>|\
product=VPN-1 & FireWall-1|rule=1|rule_uid={xxxxxxxx}|service_id=nbname|\
src=192.168.254.200|s_port=34605|dst=255.255.255.255|service=137|proto=udp|\
__policy_id_tag=product=VPN-1 & FireWall-1 [db_tag={xxxxxxxx};mgmt=cpfw-lab;\
date=1409172966;policy_name=Standard]|\
origin_sic_name=cn=cp_mgmt,o=cpfw-lab.home.rootshell.be.pbo6og
...
The file is easy to parse, fields are delimited by “|” and prepended with names. It’s peace of cake to integrate this into ELK. Personally, I deployed a logstash-forwarder which sends the events to my central server. Here is my logstash.conf:
{
   "network": {
     "servers": [ "192.168.254.65:5000" ],
     "timeout": 15,
     "ssl ca": "/etc/ssl/certs/logstash-forwarder.crt"
   },
   "files": [
      {
         "paths": [
            "/var/log/checkpoint/fw1.log"
         ],
         "fields": { "type": "checkpoint" }
      }
   ]
}
On my ELK, grok is used to parse the events:
filter {
   #
   # Checkpoint OPSEC/LEA event (lab)
   #
   if [type] =~ /^checkpoint/ {
      grok {
         match => { "message" => "time=%{DATA:timestamp}\|action=%{WORD:action}\|orig=%{IPORHOST:origin}\|i\/f\_dir=%{WORD:direction}\|i\/f\_name=%{WORD:interface}\|has\_accounting=%{INT:accounting}\|uuid=%{DATA:uuid}\|product=%{DATA:product}\|rule=%{INT:rule}\|rule_uid=%{DATA:rule_uid}\|*src=%{IP:src_ip}\|s_port=%{INT:src_port}\|dst=%{IP:dst_ip}\|service=%{INT:dst_port}\|proto=%{WORD:protocol}" }
         add_tag => "checkpoint"
      }
      mutate {
         gsub => ["timestamp"," "," "]
      }
      date {
         tags => "checkpoint"
         match => [ "timestamp", "ddMMMYYYY HH:mm:ss" ]
      }
   }
}
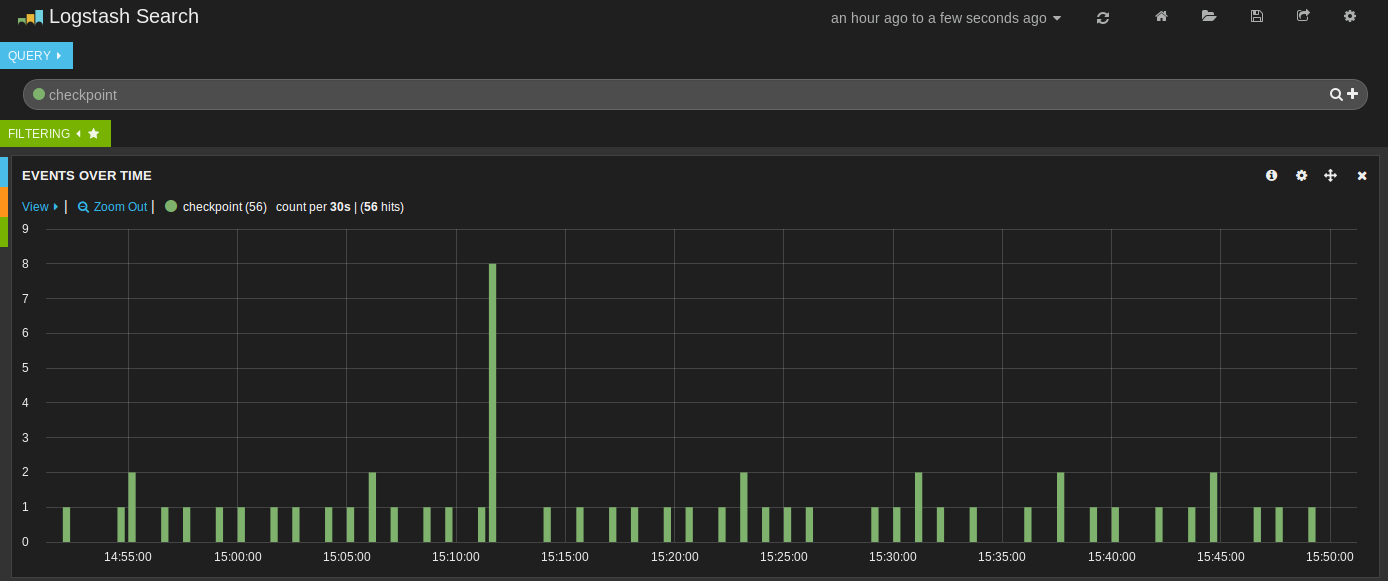
Here are the results in Kibana:
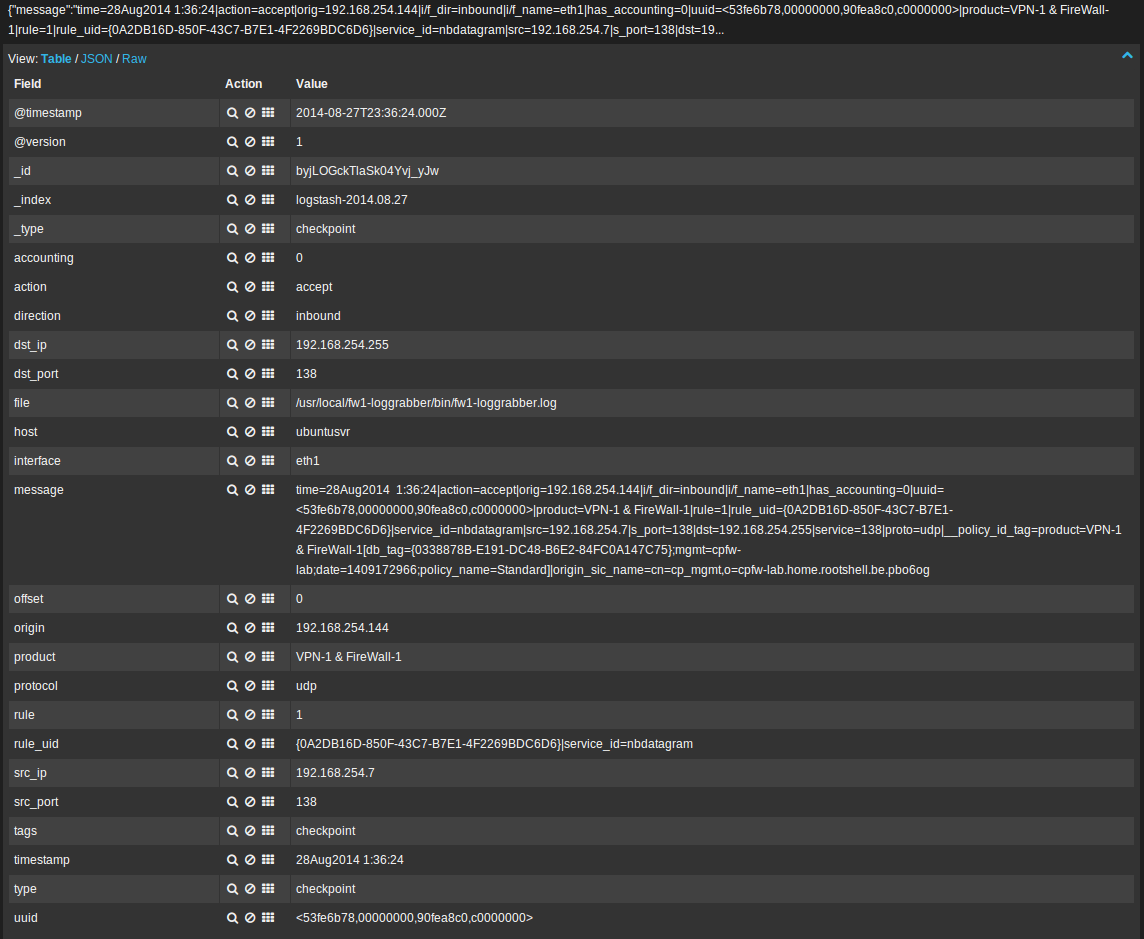
Note that the parsed events are just the basic event (communication between two hosts). The following fields are extracted:
- src_ip
- src_port
- dst_ip
- dst_port
- interface
- direction
- action
- rule #
- protocol
Check Point has plenty of other interesting fields and events (related to other blades like IPS, URL filtering, …). More grok regex’s must be created for each of them. A good reference is the document “LEA Fields Update“. Happy logging!
Hi, i fiddled with it a little, it seems for me cleaner to send to stdout and send through pipe to netcat, to forward it to any server we want.
That way you don’t have additional files to manage on your File system.
If someone isn’t lazy, you can change the code to send straight to a server.
Our new FW1-LogGrabber release v2.1 works with the latest Checkpoint SDK with SHA-256 support:
https://github.com/certego/fw1-loggrabber/releases/tag/v2.1
Nice guide and it worked!
Until Checkpoint and PCI-DSS require SHA-256.
Checkpoint doesn’t seems to be willing to update SDK.
Anyone who has managed to resolve this to work with SHA256 in the firewall?
Hi. Thanks for that article. How about fw1-loggrabber filters? For example: I do not want to get lines with rule=22. How can I do this ? I tried something but never success..
Typo fixed, tx!
in the very first few lines it reads as LOGSTRACK. Instead,should it be LOGSTASH?
Read your article with interest as I have been tackling the same issue . couple of observations.
kv probably isnt appropiate due to the presence of false kv values in the Checkpoint object (has cn=,o=)
Your match works for basic retrieval however running it on current Elk stack 1.4.2 on Ubuntu 12.04 against checkpointsplat R76 I think some of your expressions need refinement.
Looks like the Rule_UID match is greedy as typically it includes service_id. A named patterned for rule_uid as follows seems to fix that:
{(?([0-9A-F]{8}-[0-9A-F]{4}-[0-9A-F]{4}-[0-9A-F]{4}-[0-9A-F]{12}))}
In addition there are several variants of field ordering relating to NAT
However your basic technique appears more robust than my initial approach of building up a series of named patterns to represent all forms resulting in about 50 defined patterns defined in hierarchial order!
I’m a bit angry at check point because they don’t document the fields or the messages they’re using. It’s especially annoying with SmartDefense (IDS-like module): you don’t know in advance which messages you will get and information they will contain.
BTW, even proprietary software is using fw1-loggrabber in the backend.
Hi Xavier,
I try to create a similar system with ELK like smart event blade, isn’t the size of elasticsearch index the same with the raw log result from fw1-loggraber?
Tx for the tip!
The grok pattern you’re using looks like a great use for the kv filter!
Your log format looks like ‘time=XXX|action=abcd|….’ and the kv filter is specifically built to parse this and set ‘time’ to ‘XXX” etc.
You aren’t required to use the kv filter, but it should save you time in the future when dealing with ‘key=value’ style logs! 🙂
Happy logging!
Hi Daniel,
The goal is not to keep the logs collected by fw1-loggrabber. Once they have been collected by logstash, you can get rid of!
fw1-loggrabber performs a rotation of logs after x MBytes received. Just remove the old logs…
Hi,
I have that in mind to, i successfully grab/pull the log to loggrabber server but I stop after seeing the raw log for just 1 hour is more than 1gb, its different from the log file in checkpoint os ,for 1 day it only not more than 2GB data.